Ask students, “We live in a world with
a growing human population. If more people eat from the top of the
food chain, will we able to feed more or fewer people altogether?”
Take a vote for more versus fewer, then ask a few students from
each group to share their thoughts on the question.
Explain that the reason for this is that
only part of the energy that is stored in one trophic level is passed
on to the next level. That is because the organisms use most of the
energy that they take in for life processes. These include: movement,
growth, respiration, and reproduction. Some of the remaining energy
is released into the environment as heat.
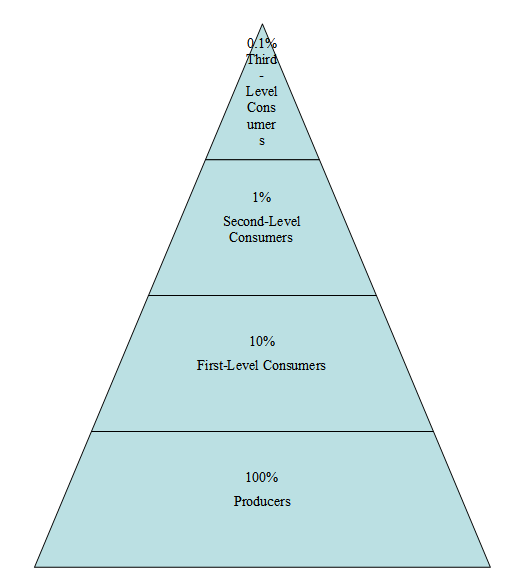
Draw an energy pyramid like the one below on
the board or overhead projector (S-B-2-3_Energy Pyramid.doc and
S-B-2-3_ Energy Pyramid Worksheet KEY.docx).

Energy Pyramid
Tell students that only about 10 percent of
the energy available in one trophic level is available to organisms
in the next trophic level. This is sometimes called the Ten Percent
Rule. Note: Studies have shown that the energy efficiency in
food chains ranges from 1 percent to 20 percent, but the Ten Percent
Rule is still used as a general model to show energy transfer in
ecosystems.
Show students the food chain below:
Grass → Cows → Humans
Have them draw a three-level energy pyramid
in their notes, with grass at the bottom, cows on the next level, and
humans on top. Ask students, “What percentage of the energy
captured by grasses during photosynthesis ends up in the humans who
eat the cows?” Elicit that humans have access to as much as one
percent of the energy, and ask students to explain what happened to
the rest of the energy. Explain that the more levels there are in a
food chain, the less energy is available for the top-level consumers.
Many producers are required in order to support fewer herbivores, and
even fewer carnivores.
Have students draw an energy pyramid for a
five-step food chain. Ask students, “If 100 percent of the
energy is available to the first trophic level, what percent of the
energy is available at the highest trophic level?” At the fifth
level, only 0.01 percent of the energy is available to organisms.
Explain that the amount of energy available
in food is measured in kilocalories, which are expressed as Calories
with the letter C. Ask students, “If the producers in a food
pyramid contain 500,000 C of food energy, how much energy will be
available to the first-level consumers?” 50,000 C will be
available, because that is 10 percent of 500,000.
Distribute the Energy Pyramid Worksheet (S-B-2-3_ Energy Pyramid Worksheet.docx) and have
students work independently to complete the questions.
Small Group Activity: Energy Pyramid
Divide students into groups of three and
give each group one piece of graph paper (S-B-2-3_Graph Paper.doc) and a pair of scissors. Assign students the
roles of producer, primary consumer, and secondary consumer. Have the
producer cut a 10 by 10 block of squares from the graph paper. This
block represents the total amount of food energy stored in the
producer. Have the producer cut a row of 10 squares from the block
and hand it to the primary consumer. The 10 squares represent the
amount of energy that is transferred up the food chain to the primary
consumer. Have the primary consumer cut 1 square from the row and
pass it to the secondary consumer. Ask students what percentage of
the original energy stored in the producer reaches the second level
consumer (i.e., only 1 out of 100 squares, or 1 percent).
Explain that the law of conservation of
energy states that energy cannot be created or destroyed; it can only
transform into different forms of energy. For example, chemical
energy from food can become kinetic (i.e., movement) energy in an
organism.
Then, provide each group of students with
diagrams of matter cycles (i.e., nitrogen cycle, carbon cycle, and
water cycle) (S-B-2-3_Matter Cycles.docx). Have
students examine the diagrams to trace the flow of matter through the
ecosystem. Have each group create a Venn diagram comparing the flow
of energy through ecosystems with the cycling of matter.
Example:
Students should infer that matter is
recycled through an ecosystem, while energy flows through a system
and changes form as it moves. Also, energy flows through feeding
relationships of organisms, while matter cycles through living and
nonliving parts of an ecosystem. The similarity students should find
is that both energy and matter are conserved in an ecosystem.
Define the term biogeochemical cycles.
Explain that while energy does not cycle through an ecosystem,
chemicals are recycled. Chemical elements, such as nitrogen, carbon,
and compounds, such as water, cycle through the organisms and enter
into the atmosphere, the oceans, and even rocks. Since these
chemicals cycle through both the biological and the geological world,
we call the cycles biogeochemical cycles.
To conclude the lesson, hold a whole-class
discussion about how conservation of energy and conservation of
matter affect each of us.
Extension:
-
At the beginning of the lesson, students who need
opportunities for additional learning may benefit from using one of
the food webs from Lesson 1 as they try to construct a long food
chain.
-
Also, provide students who may need opportunities for
additional learning with a diagram of the water cycle (which is less
complex and should be the most familiar) during the Venn diagram
activity. Ask students to describe to you the various stages of the
cycling of water in complete sentences.
-
Have students performing above and beyond the standards read
about biomagnifications in ecosystems and give a short oral
presentation to the class (see the “Biomagnification: How DDT
becomes concentrated as it passes through a food chain” Web site
in Related Resources).
