Ratios and Probability
Ratios and Probability
Grade Levels
Course, Subject
Rationale
Vocabulary
Probability: The measure of likeliness that an event will occur. The higher the probability that an event will occur, the more certain it is that an event will occur.
Ratio: A statement that shows the comparison between the size of two or more numbers.
Ways to Write Ratios
Word: two to three
Numbers: 2:3
Fraction: 2/3
Chance Event: The chance that any given event will occur based off of data and probability.
Spinner: A tool used to assist in formulating ratios.
Objectives
In this unit, students will review the concept of ratios and probability and learn how to formulate ratios and expected outcomes/ chance events through using spinners. The emphasis of this lesson is on analyzing given data to formulate correct ratios and predict chance events. Students will:
- effectively use spinners to develop data.
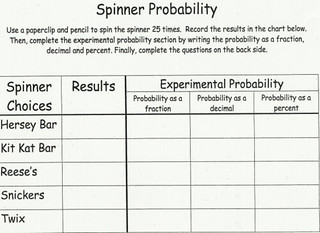
- record and organize data into a graphic organizer (table/chart)
- analyze data to create ratios.
- write ratios in three different formats.
- compare several ratios to understand probable outcomes.
- describe how given data helps formulate predictions (chance events).
- explain the relationship between fractions and ratios.
Lesson Essential Question(s)
- How is mathematics use to quantify, compare, and represent numbers?
- How are relationships expressed mathematically?
- What makes a tool and/or strategy appropriate for a given task?
- How can ratios be used to identify and compare parts of a set to the whole set?
Duration
This lesson will take between 35-40 minutes. The "Spinner Activity" should take no longer than 15 minutes,
Materials
The following materials will be needed for this lesson:
Pencil
Paper Clip
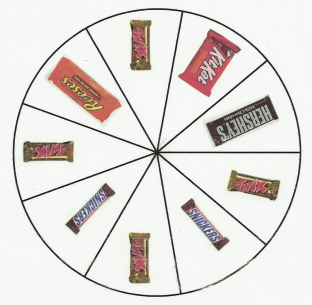
Created Spinner
Data Table
Calculator
*The pencil and paper clip will be used to create the spinner. Students should have an extra pencil to record data.
Suggested Instructional Strategies
This activity is already differentiated and scaffolded out through collaborative groups working together to complete the activity.
Instructional Procedures
This lesson is set up to appeal to all learning styles and has a varied instructional format to reinforce previous concepts learned as well as new concepts. The teacher will begin this lesson by assessing student knowledge about ratios and probability through informal student led discussions. Students will then select a representative from each group to share the agreed upon definitions of the two terms. Once completed, the teacher will display the correct definitions on the board, in which students will then record the terms in the math composition book. In addition to recording the vocabulary terms of ratios and probability, students will also examine chance events and what a spinner is.
The next part of this lesson will require students to perform an activity in groups.

"Spinner Activity"
Students will be broken up into heterogeneous collaborative groups that contain 4-6 students in each group pending class size. Each student will be given a graphic organizer which will be filled out during the activity to help record data. In addition to the graphic organizer, each group will be given the spinner sheet. The students will also be issued a pencil and paper clip which will be used as the actual spinner for the activity. The students will take turns spinning the spinner 25 different times and record the results for each spin in the graphic organizer. Within the graphic organizer, the students will keep a tally chart for the number of times the spinner lands on a selected piece of candy. The students will then examine the tallies to formulate ratios.
Once all data is recorded, students will form ratios based off of given questions. These questions will require students to express ratios in the three various ways as well as determine the chance of events. The given questions students are to answer are listed below.

Ratio Expressions
Word: five to seven
Numbers: 5:7
Fraction: 5/7
Questions
1. Which candy bar is your spinner most likely to stop on based on the experimental probability? Why do you think this is true?
2. Which candy bar is your spinner least likely to stop on based on the experimental probability? Why do you think this is true?
3. Which candy bar is impossible for the spinner to stop on based on the experimental probability? Why do you think this is true?
4. Which candy bars are equally likely for the spinner to stop on based on the experimental probability? Why do you think this is true?

Once questions are answered by the collaborative groups, elected group members will share results to the whole class. The students will be assessed through informal observations throughout the "Spinner Activity". The graphic organizer may be collected and used as a classwork grade. To give students an assessment about ratios and probability, see the created assessment below in the formative assessment section.
Formative Assessment
Related Materials & Resources
Links for more Reinforcement/ Practice
https://www.ixl.com/math/grade-5/determine-the-ratio
http://www.math-aids.com/Ratios/
http://www.eduplace.com/math/mw/background/5/11/te_5_11_overview.html
Additional Visuals to Teach Ratios (Videos)
https://www.khanacademy.org/math/cc-sixth-grade-math/cc-6th-ratios-prop-topic
https://www.youtube.com/watch?v=OjpttNMG-20
